Skip to content
Calculus · Mathematics

Calculus Grapher Simulation

Sketch any function with your finger and see its derivative, second derivative and integral drawn live. Drag a tangent along the curve and watch the area accumulate.

Interactive virtual lab · no download · works on phones and laptops

Chapter
Differentiation · Integration
For
Class 11 · Class 12 · JEE
Time
~12 min

Calculus Grapher is a Pro simulation

Pro opens all 125 virtual labs — 483 simulations with guides and quizzes.

How to use it

  1. 1Drag on the top graph to push and pull the curve.
  2. 2Choose a preset: sine, parabola, step, triangle.
  3. 3Turn the derivative, second derivative and integral graphs on and off.
  4. 4Drag the reference line to compare values at one x.

What to notice

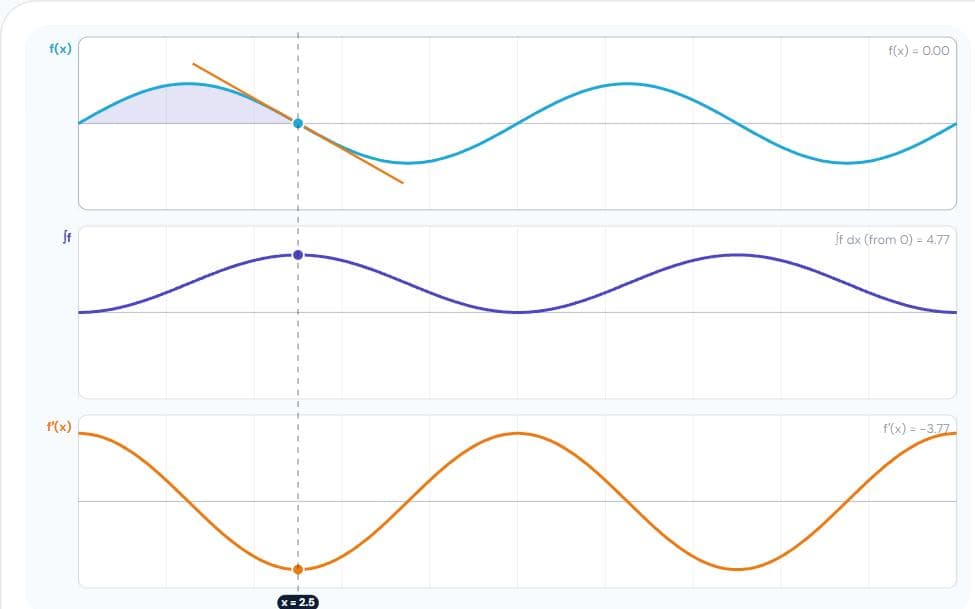
  • Where f has a peak or a trough, f′ crosses zero.
  • Where f is concave up, f″ is positive.
  • The integral grows where f is above the axis and falls where it is below.
  • A corner in f becomes a jump in f′.

For teachers

A ready-made teaching kit comes with this lab

  • Lesson plan

    21 min, 4 steps

  • Ask the class

    3 questions with answers

  • Quick quiz

    7 questions, printable

  • Key formulas

    2 formulas

About the Calculus Grapher simulation

The derivative of a function is the slope of its graph at each point, and the integral is the area under it. Drawing a function together with its derivative and integral shows how they are tied: where f rises, f′ is positive; where f has a peak, f′ is zero; where f′ is positive, the area keeps growing.

In this calculus grapher you draw or push and pull a curve by hand, or start from a preset, and see its derivative, second derivative and integral redrawn instantly, with a tangent line and a running area at a movable marker. It covers Limits and Derivatives in Class 11, Application of Derivatives and Integrals in Class 12, and JEE.

Also covers: derivative, integral, tangent, slope, area under curve, differentiation.
Frequently asked questions

What does f′(x) = 0 tell you?

The graph is momentarily flat: a maximum, minimum or point of inflection.

What does the second derivative tell you?

Concavity: f″ > 0 means the graph curves upwards, f″ < 0 downwards.

Why does the integral keep growing where f is positive?

The integral is the accumulated area, and positive f adds positive area.