About the Curve Fitting simulation
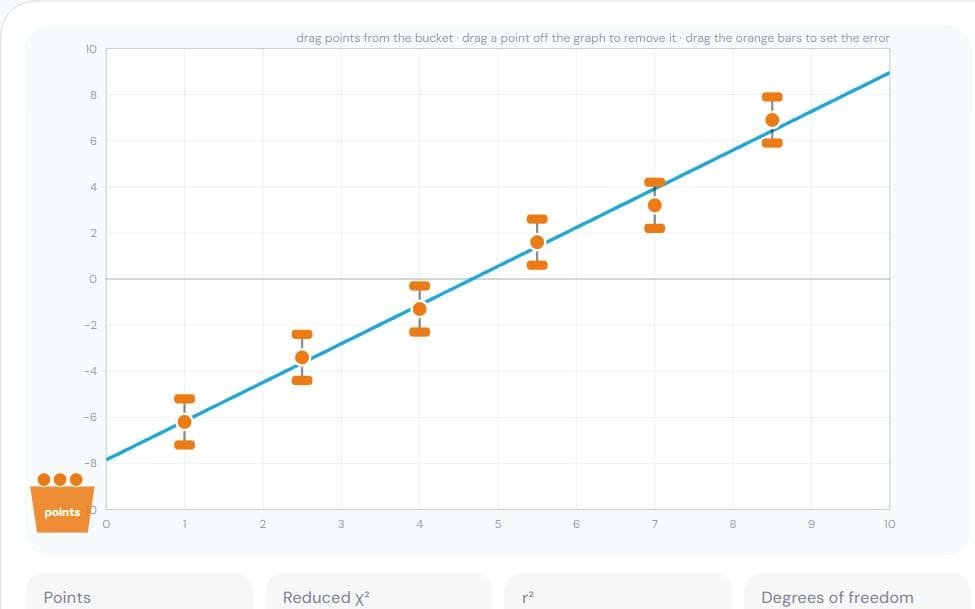
Real measurements never lie exactly on a line or a curve. A best-fit curve is the one that makes the squared distances from the points as small as possible — the method of least squares — weighting each point by how precise it is. The chi-squared value tells you whether the fit is as good as the error bars say it should be.
In this curve fitting simulation you drag data points and their error bars, fit a linear, quadratic or cubic curve, adjust the coefficients by hand to see how the fit gets worse, and read r² and reduced χ². It supports Statistics in Class 11 maths and the graph work of physics practicals.
Also covers: least squares, linear regression, best fit, chi square, correlation, error bars.