Skip to content
Statistics & Probability · Mathematics

Plinko Probability Simulation

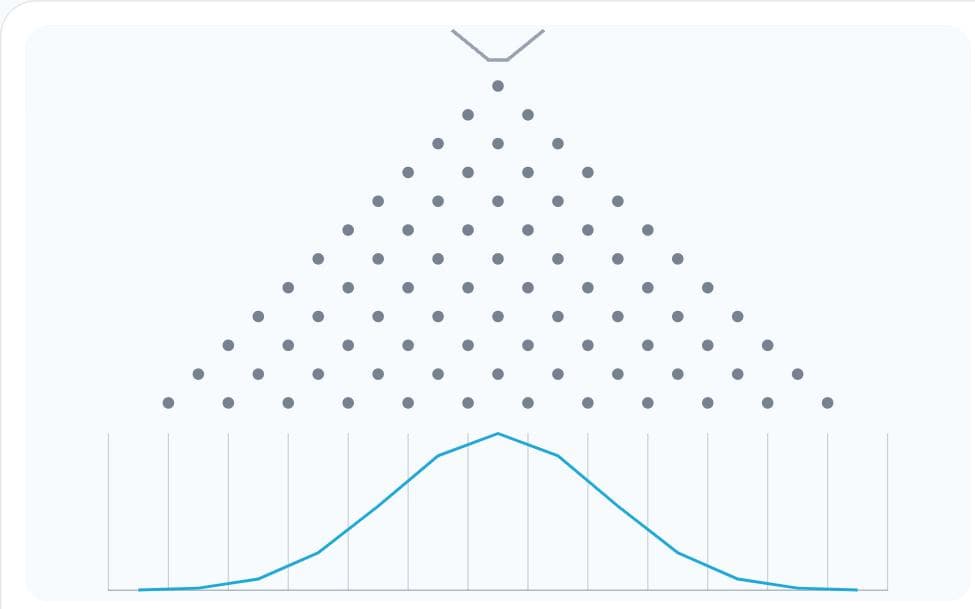
Drop balls through a triangle of pegs. One ball's path is random, but a thousand pile up into the binomial distribution — change the bias and rows and watch it shift.

Interactive virtual lab · no download · works on phones and laptops

Chapter
Probability · Statistics
For
Class 10 · Class 12
Time
~10 min

Plinko Probability is a Pro simulation

Pro opens all 125 virtual labs — 483 simulations with guides and quizzes.

How to use it

  1. 1Drop 1, 10 or 100 balls, or let them stream.
  2. 2Change the number of rows and the probability p.
  3. 3Switch between balls and histogram, and show the ideal distribution.

What to notice

  • Each peg is a coin toss: right with probability p.
  • The bin a ball lands in counts its right turns — a binomial random variable.
  • Mean = np and standard deviation = √(np(1 − p)).
  • More balls → the histogram matches the theory more closely.

For teachers

A ready-made teaching kit comes with this lab

  • Lesson plan

    19 min, 4 steps

  • Ask the class

    3 questions with answers

  • Quick quiz

    6 questions, printable

  • Key formulas

    3 formulas

About the Plinko Probability simulation

Drop a ball through rows of pegs and at each one it goes left or right at random. The number of right turns follows a binomial distribution, so the balls pile up in a bell-shaped histogram — the binomial approaching the normal curve as the number of rows grows. Bias every peg and the whole pile shifts.

In this Plinko probability simulation you choose the number of rows and the probability of going right, drop balls one at a time or in a stream, and compare the histogram with the ideal binomial, including the mean np and standard deviation √(np(1−p)). It covers Probability in Class 10 and 12 and Statistics in Class 11.

Also covers: galton board, binomial distribution, normal distribution, probability, histogram, mean, standard deviation.
Frequently asked questions

Why do the balls form a bell shape?

There are many more paths to the middle bins than to the edges — ⁿCₖ is largest near k = n/2.

What is the mean bin for 12 rows with p = 0.5?

np = 6, the middle bin.

What happens with p = 1?

Every ball goes right at every peg and lands in the last bin.